VIDEO QUALITY MEASUREMENT TOOLS - HOW TO CHOOSE THEM AND USE THEM
28th Dec 2017
The biggest video streaming platforms like YouTube are looking at 400 hours of uploaded video content every minute. Netflix, although seemingly low comparatively at 1000 hours during 2017, still needs to make its encoding of streams seamlessly efficient, and humans just don’t cut it in terms of efficiency for the creation of customised encoding ladders for every piece of video content.
Video quality measurement tools, or video quality metrics, drive this essential efficiency. Let’s find out how…
What is measured by video quality measurement tools?
Error-based metrics
This class of metrics is used to compare original and compressed images, and measures the difference between the two, resulting in a mathematical ‘score’. A good example of this is PSNR (peak signal to noise ratio), which can give insights into errors, such as colour shifts.
The results can be misleading, when it comes to quality, particularly in the example of a colour shift, which may be imperceptible to the human eye. However, these types of results are easy to understand, and can give useful data insights.
Perceptual-based models
This class of metrics, including Structural Similarity index (SSIM), try to predict how a human viewer will rate a video, based on the perception of errors. This differs from PSNR (error-based metrics), in that PSNR looks at ‘absolute’ errors. SSIM considers the image degradation perceived as change in structural information. The model also incorporates luminance masking and contrast masking to take a ‘human view’.
Although more complex, perceptual-based models can give a more accurate interpretation of the expected human view.
Machine learning and metric fusion
This class of metrics takes on a different view using machine learning, and rates content from 1 to 5 (1 being unacceptable – 5 being excellent) during subjective testing.
As the other metric classes, machine learning begins with a mathematical model, but is much more finely-tuned to ‘training’ in terms of specific requirements. By performing tests and trialling datapoints such as contrast and brightness, for example, the system learns which values are producing a good or bad score.
What metric should you be using?
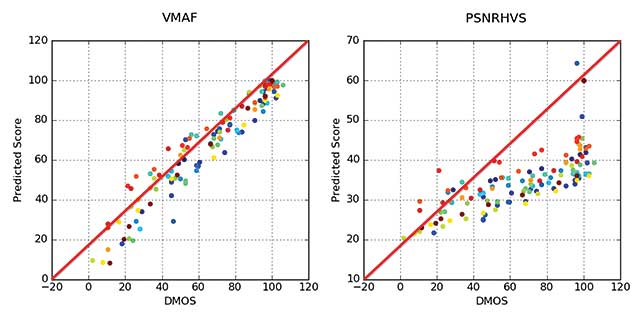
According to industry experts, and looking at the scatter graph below, taken from a Netflix post on VMAF, which compares the VMAF scores and also the PSNRHVS metric scores to the DMOS scores, it is interesting to observe that the tighter to the red line the metric results are, the more the human subjectivity is accurately predicted.
However, experts also know that accuracy, although critical, is not the only thing to consider when deciding upon which metric is going to be best to use.
Other types of metrics to consider here are:
- Referential vs non-referential – comparing the encoded file to the original for quality measurement, vs. analysis of the encoded file only.
- SSIMPLUS – this score gives a measure of 1-100, with scores of 80+ predicting a subjective viewer rating of excellent. (SSIM and Multi-scale SSIM are more accurate than PSNR, there is a smaller range in its scoring system).
- MOS-based metrics – rate from 1-5 (as mentioned above).
- PSNR – measures decibels and rates 1-100. (Netflix deems values in excess of 45dB to be of no benefit). Perfect for comparison of full-res output to full-res source.
- VMAF – scores rated from 1-100 with higher scores better. Analysis of an encoding ladder will give a better, uncomplicated comparison.
Choosing the best tools for access and computation of metrics
There is a wide range of video quality measurement tools out there, with an equally-wide range of pricing. Of course, the choice of video quality measurement tools will depend on your individual needs, the volume of benchmarking you carry out, and content produced.
According to the experts, the more expensive the tool you choose, the more idiosyncrasies it will have! To truly define the value of your video quality measurement tool, it must be used. This is why it is wise to thoroughly trial a tool before you pay big money for it and explore all its abilities. Verification of the results subjectively is also a big tip from the experts to give you confidence that the results actually do represent real metrics.
Over time, and as the business matures, personal and consumer preferences will inevitably evolve, and you may find that your metrics requirements change, either by design or by project-dependency.
Talk to The Streaming Company today, and let us help you to decide which solutions will work for you and your business needs.
